The NFL Draft features numerous trades, many of which seem to conform to the classic draft value chart. It's almost dogmatically accepted, but does it always make sense? My dad once told me to look at the extremes. He was referring to sanity checking if a proposed function made sense or not by testing it at variable=0 or infinity, but the same concept can apply here. Granted I'm backing the following up with little concrete data, but let's take a look at a few examples:
Trading from 2nd to 1st costs about a 2nd rounder. Getting to the top spot means you can guarantee picking that one blue-chip, can't-miss tackle or quarterback. If there's a dropoff after them, forfeiting a good shot at another starter makes sense. If you didn't, you'd be taking a bigger risk on the 1st rounder not working out. If it only cost an additional 3rd, this would be a clear win for the team trading up. If it cost an additional 1st, it would mean the team misses out on a premium pick. This passes the smell test.
The 20th pick is valued equally to the 33rd and 65th. At 20, there's unlikely to be a premium quarterback, tackle or pass rusher. While there may be an elite tight end, nose tackle or inside linebacker, these are positions of lesser impact. In other words, we're looking at players who either have limited impact no matter what, or have a red flag in either college production, measurables or character. The 33rd pick is a little more of the same, and may actually be more appropriate value-wise for the lesser impact positions. The 65th is skirting the territory where guys with clear NFL upside are disappearing, so finding a good role player is often the best outcome. This, again, feels like a reasonably fair trade. Another way to look at it is: the team with the top pick got their blue-chipper, and now they want to go all in for a particular player they want to take a chance on instead of waiting for the board to play out. Never underestimate the perceived value of getting to pick the particular player you want instead of taking who is left for you.
In general, the classic chart lets a team move up about half a round by trading their pick in the next round (ex: mid-2nd + 3rd = borderline 1st), and about a quarter round by throwing in their pick from 2 rounds later (ex: mid-2nd + 4th = higher pick by about 8 spots in the 2nd). What this expresses is that getting to pick the particular player they feel good about is worth not getting to take a chance on a lesser prospect later.
A very important thing to remember here is that the values assigned to each pick are generalized guidelines. Making a big trade up in some drafts has little to no reward. For example, 2013 and 2012 featured similarly graded blue-chip players at the same premium position. The Redskins had no reason to trade beyond the 2nd pick because both Luck and RG3 were franchise-changing quarterbacks (pending discovery of the indestructible ACL ... ). This year, the Jags had no reason to trade up to take the tackle of their choice because both Fisher and Joeckel are dominant, can't-miss players. In other words, the 1st and 2nd pick were worth about the same. Suppose RG3 wasn't there last year. Now suddenly, the benefit of trading to 1 is huge because no other quarterback in the draft compares to Luck. 2013 featured a glut of similarly graded players at a variety of positions. The Raiders traded their 3rd pick to the Dolphins for the 12th and 42nd. Per this chart, they gave the Dolphins a 50% discount. Why? Because they were desperate to add extra picks, and the quality of player they were likely to draft at 12 was not much lower than what they would have goten at 3. Getting 2 shots at the premium part of the prospect list was worth passing on Milliner or whoever they would have taken in their original spot. As such, we can't say that any trade value chart is inherently correct, there's too much contextual information missing without actual players plugged in.
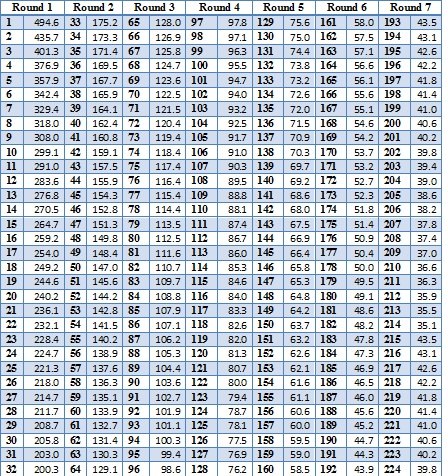
We can, however, call out clearly degenerate cases. In the latter rounds, the gaps in relative values of picks get oddly large. Per the chart, the 211th pick is worth as much as 222, 223 and 224 combined. We're really looking at the scraps at this point, and picks are really a crapshoot here. We're essentially talking low-yield lottery tickets (keep in mind most 7th round picks won't even make the final roster). So why should 1 of these (at 211) be worth as much as 3 of these just a few spots later? This makes no sense at all. Similarly, the last 3 picks of the 6th round are worth as much as the last pick in the 4th. In the 4th, we're still looking at guys who have good physical skillsets and are expected to make the team and contribute. 6th rounders usually have significant physical shortcomings that most never make it past.
The classic chart uses an approximately exponentially decreasing point value model (about a factor of 2 per round) until the top of the 5th, when it changes over to an almost exactly linearly decreasing model. I guess it's trying to account for teams targeting specific crapshoot players, which again has perceived value to the team ... but really, would you elect to have more randomly given scratchers tickets, or hand-pick fewer of them?
Overall grade: B+. The top 4 rounds seems pretty reasonable, but the scale erodes in the later rounds.
To attempt to address the perceived arbitrariness of the classic model, a group created the Harvard model. Right off the bat we can tell that the later rounds are addressed: there's very little difference between 6th and 7th rounders, in fact it's not even possible (per the chart) to engineer a trade back in the 6th without the buyer grossly overspending (or getting into some crazy exotic pick swapping). Unfortunately the Harvard model completely faceplants in the earlier (aka: "important") rounds. For a 7th rounder, a team can move from the 32nd to the 20th, or from 16th to 10th, or from 10th to the 6th pick, or from 5th to 3rd, or 3rd to 2nd. This is lunacy. That 7th rounder is worthless, and you're telling me I can instead have my choice of blue-chip prospect, maybe align that with a need, or hop forward spot(s) to get the clearly better of 2 options? No no no no no. In the Harvard model, the 1st can be had from 7th with the addition of a 2nd rounder, or from the 3rd with the addition of a 4th rounder, or from 2nd with the addition of a 6th. Again, not a chance the seller would go for it. There's also a very oddly large discontinuity form the 32nd to the 33rd pick that should make any basic sanity checker scratch their head. And just to pile it on, the last few picks in the 7th are actually more valuable than those in the middle of the 7th (though this may be a copy/paste error, the sequence from 193 repeats starting at 215).
Overall grade: F. I appreciate their attempt at a statistical approach, but sometimes we don't use the right stats or put them together the right way and a simple smell test should say "no, this doesn't make sense". Anyone who reads KC Joyner's articles should be familiar with this reaction. The meat of the draft is in the top 2 rounds and getting values clearly wrong here makes the scale unusable.
No comments:
Post a Comment